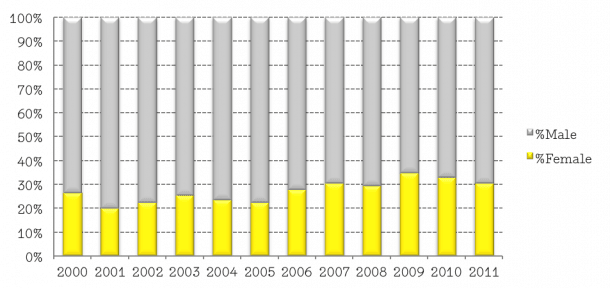
The second post updating our statistical knowledge of women’s participation in the profession, drawing on work by Gill Matthewson and Kirsty Volz. Here Gill outlines ways of measuring women’s involvement in the years following graduation.
Photo: Nick Bassett
Following on from the update on the statistics on women in Australia’s architecture schools, the second step to mapping women’s participation is to look at the profession itself. It is difficult; however, to measure women’s participation in architecture, as all the measures available only provide a partial picture. This section looks at two such measures, which each give quite different information about the number of women working in architecture in Australia.
Registration
Registration is one important way of measuring women’s participation in the profession. As of October 2012 there were 9,956 practising registered architects across the country and 2,079 of them were women (21%).1 (In 2004, 14.3% of registered architects were women.)2
Until recently, counting registered architects has been hampered by the fact that each state register is maintained separately. Many architects are registered in a number of different states; to be the signing architect in a state you must be registered in that state as well as in your home state. This doubling up distorts the figures. Our previous attempts to remedy this involved taking out those not resident in a state. However, a significant number of people are registered in one state (perhaps where they first obtained a job) but are now resident and working in another, but are not registered in their new state. This meant that our attempts at adjusting the count caused distortions of their own. (See here for an account of the difficulty of counting registered architects in Australia.)
In September 2012, the AACA published a combined register for Australia. This is still not perfect – non-practising architects for WA and VIC are included, as are companies registered in SA, and some ACT people are listed more than once. The combined register has over 12,500 entries and 11% of them (1,425) are multiple registrations. Men are more likely to be multiply registered than women (1,310 men and 115 women – 8%). Nonetheless, for the first time it is possible to eliminate multiple state registrations and count an architect only once.
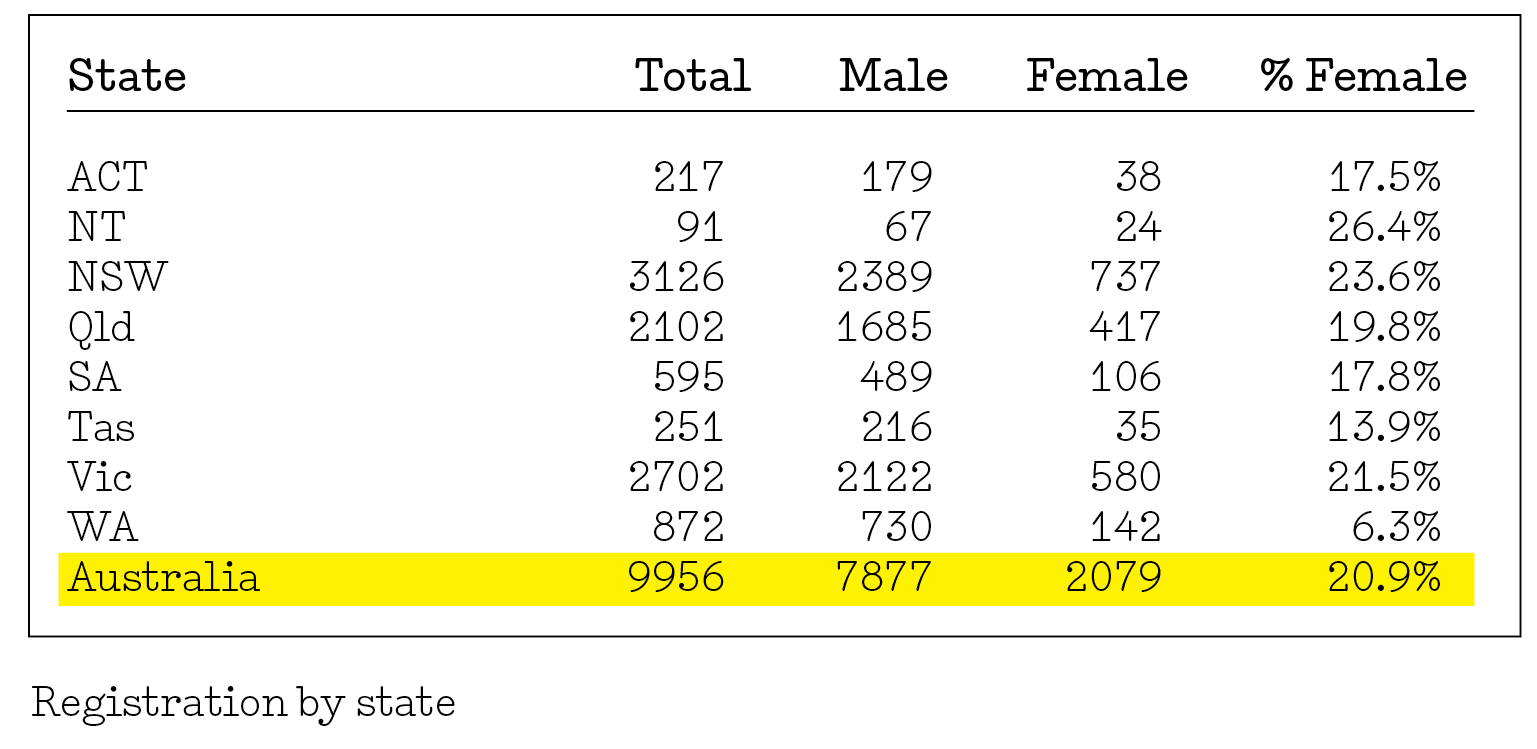
Although there has been a significant increase in numbers and percentages of women who are registered architects since these figures were last assembled in 2006, the figures are lower than what might be projected from the graduation rates. They are also lower than in the professions of law (46%) and medicine (36%), with which architecture is often compared.3

UK comparison
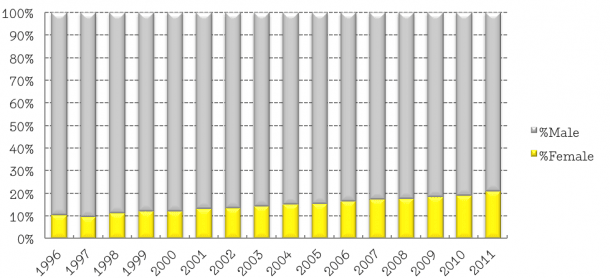
The proportion of women registered as architects in Australia is very similar to that in the UK (the UK data is far easier to access). For 2011, there were 21% women on the UK register (although 20% for UK resident-only architects).4
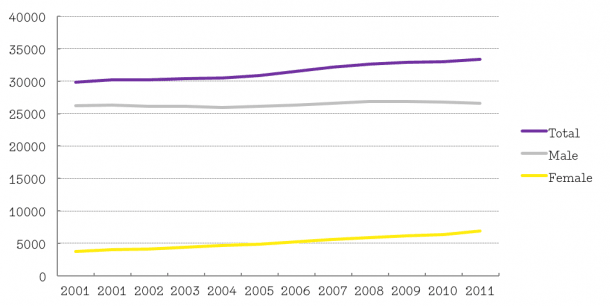
- Since 2000 the overall UK register has increased by 12%.
- The number of men on that register has increased 13%.
- The number of women has increased by 89%.
Such dramatic growth in the number of women is partly an indication of low numbers of women in 2000 when women were 12.3% of the register (they were 8% in 1991). The year-on-year increase of women to the UK register is impressive and parallels growth in Australia.
It should also be noted that the growth in total numbers on the register seems to be supplied by the entry of women. The number of men has remained relatively static over the last 10 years.
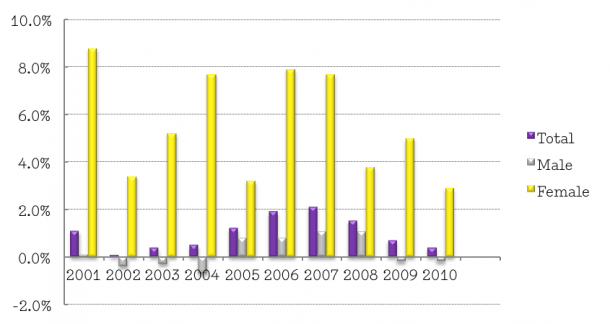
Of note is the actual decline in the number of men on the UK register for some of the years, as shown below.
Note: from 2005–2008 the actual number of men and women added to the register in each of these years was similar. But, as a percentage, the same number of women represents a higher growth. This is, once again, because of the lower numbers of women to begin with.
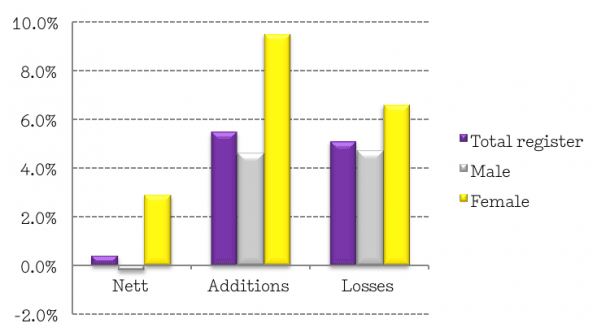
This dramatic growth may, however, be masking something: a revolving door phenomenon whereby women are coming on to the register in great numbers, but many are also leaving. For the year 2009 to 2010 the loss of women to the register, as a percentage of the total number of women, was higher than the loss of men to the register as a percentage of the total number of men. It was also higher, as a proportion, than overall losses. There is, however, not enough data available to study whether this is a consistent pattern over time.
New to the register
Perhaps of more relevance is the proportion of women among those architects who become newly registered each year. In Australia, the proportion of successful registrants has been 32% averaged for the last five years (1,053 women, 3,330 total, 2007–2011).5 This is markedly less than the average graduation rate of 41%. It is still; however, a high enough rate to be increasing the percentage of women on the registers year on year.
The UK rates of registration for women are higher, averaging 36% for the last five years. The graduation rates from UK schools are currently unknown to us.
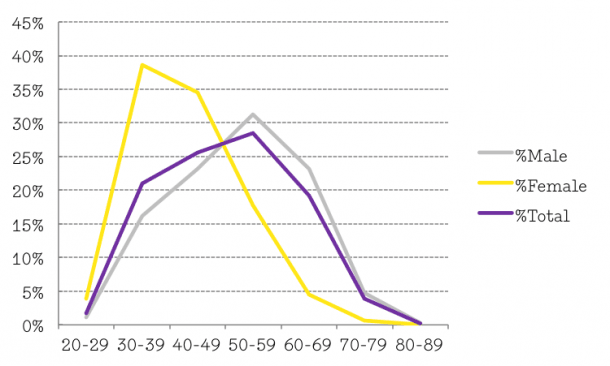
Current data from the NSW Registration Board data for active registrants also shows a pattern in the declining proportion of women in specific age groups. This reflects the proportion of graduates for these age groups, but there also appears to be additional attrition. The 20–29 and 30–39 age groups track well alongside graduate proportions. However, the 40–49 age group (at 29%) tracks less than the graduate proportion of 36%. The graduate proportions for over 50s is unknown at this stage. 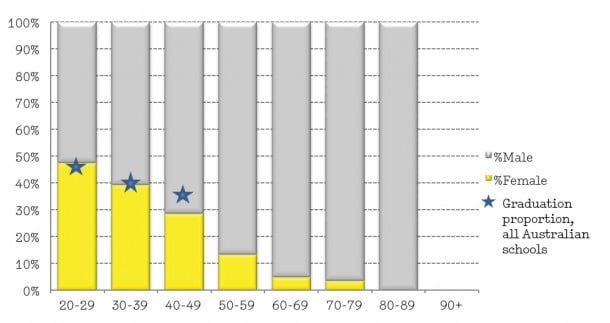
- Percentage of female registered architects by age group vs graduation rates – NSW register
However, it needs to be noted that the age groupings are not completely clear-cut – a certain percentage of graduates each year are mature students. The chart above has not been adjusted to account for this. Note also that the NSW register has a higher than national percentage for women.
Significantly, in NSW the greater proportion of practising registered women are in the younger age groups: 77% are under the age of 50, while 60% of the practising registered men are over the age of 50.
Overall, it looks as if women may increasingly, be a significant proportion of the profession as measured by registration.
The 2006 Census data
Not every graduate of an architecture school who is working in the profession; however, chooses to register. In New Zealand, research has discovered that less than 50% of graduates ever register; Australia is likely to be similar.6 An architectural firm is legally required to have one registered director or partner, and all projects within the firm can occur under that one registration. Without registration one is not legally permitted to call oneself an architect or, rather, to represent to the public that one is an architect. It is only the title architect that is protected by law, not the work itself. In addition, some graduates consider the process of becoming registered laborious, expensive, and of little assistance or relevance to either their career progression or the way they practice.7
Under this legislative structure, it is then quite possible to do the work of an architect without being registered. In this respect, architecture differs markedly from medicine and law where one must be registered or licensed in order to practice. The comparison to law and medicine then becomes problematic if we take registration as the measure, which is why Canadian research in 2000 recommended the use of Census data instead.8
Indeed, the 2006 Australian Census shows double the number of women working in architecture than the number registered in 2004. This gives us a significantly higher participation figure – registered: 14%, Census: 23%. Once the 2011 Census has been processed we will be able to update these figures. If a similar differential persists then women are likely to currently make up between 30% and 35% of the profession.
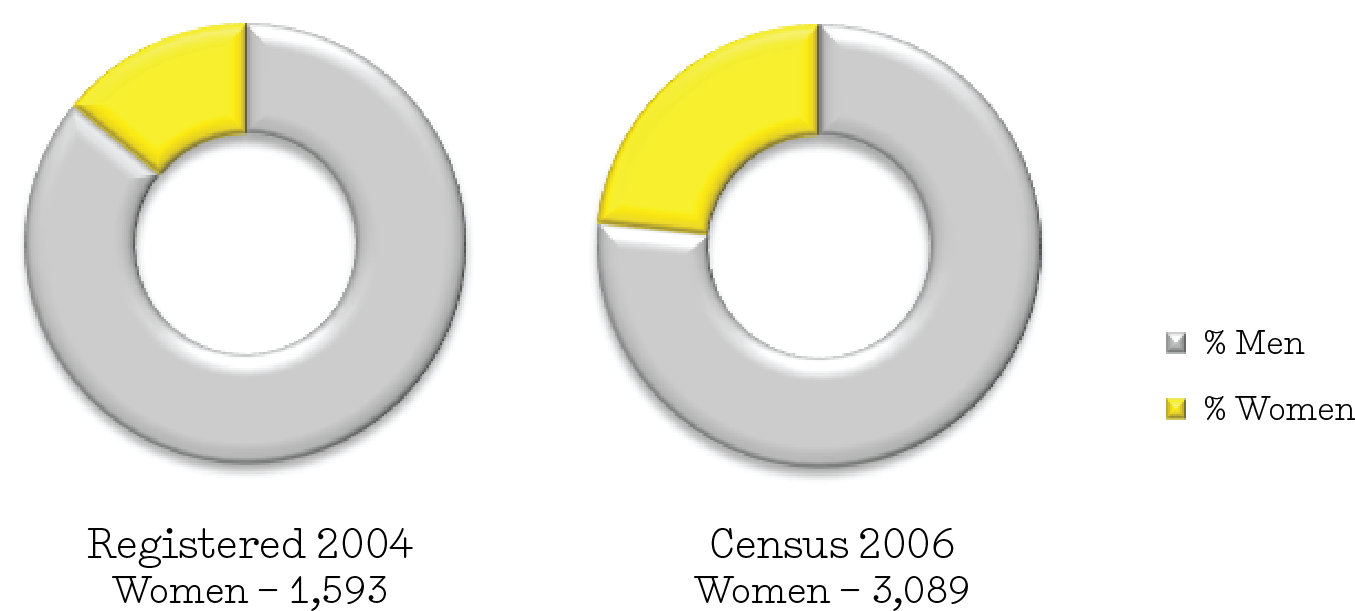
The Census also reveals the pattern of women ‘disappearing’ from the profession as they age, as does the NSW data.
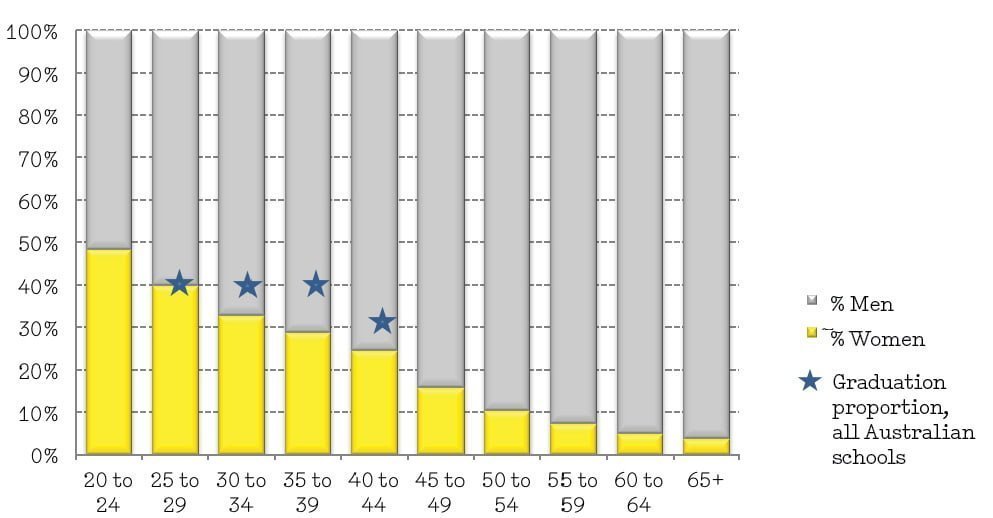
Percentage of women in architecture (Census) by age group vs graduation rates
- Data obtained from the Architects Accreditation Council of Australia (AACA).[↩]
- Paula Whitman, Going Places: The Career Progression of Women in the Architectural Profession (Brisbane: Queensland University of Technology, 2005)[↩]
- Heather Moore and Kate Potter, ‘Advancement of Women in the Profession,’ The Law Society of New South Wales (2011). Selected Health Occupations: Australia, 2006.[↩]
- Data from UK ARB Annual Reports.[↩]
- Data not available from Tas. Limited data for SA (2010 only), and NT (2008–2011 only). Given the low numbers altogether on the NT, SA and Tas rolls, their lack of data is not numerically significant.[↩]
- Errol Haarhoff, Practice and Gender in Architecture: A survey of New Zealand architecture graduates 1987–2008.[↩]
- Attitudes to registration and its desirability do change over time, see the Australian Institute of Architects 2012 Graduate Survey.[↩]
- Annmarie Adams and Peta Tancred, Designing Women: Gender and the Architectural Profession (Toronto: University of Toronto Press, 2000). The Canadian Census figures provided a nearly twofold discrepancy: registered female architects 10.1%, but in the Census 19.6%.[↩]


