What can the 2011 census tell us about the ‘half-life’ of woman architects? Gill Matthewson and Justine Clark take a look.
We recently came across an interesting post on the new website Professional Mums called “The Half Life of a Lawyer: Gender-demographics of Australian lawyers”. Catchy idea we thought. The post uses data from the 2011 census to show that “female lawyers should expect to spend less than half their life as a working lawyer” – and this in a profession where many more women enter the profession than men!
An earlier post asks the same question about lawyers, that we at Parlour are asking about architects “Why do so many women leave law firms and where do they go?” This compares the careers of lawyers and accountants – and finds that the extreme patterns of attrition in law are not matched in accounting. “As in the legal profession women start switching out of accountancy in their late 20s, but there is a much more even ‘decay’ in numbers between women and men as they age.”
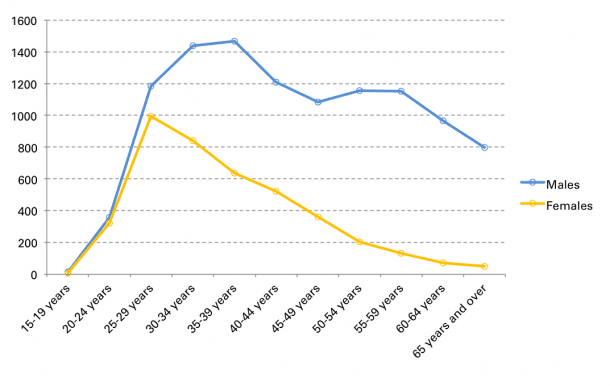
How does is compare with architecture we wondered? So the ever-efficient Gill Matthewson did some number crunching of her own and came up with the graph below.

What does it tell us? The numbers of women peak in architecture at a similar age to law and accounting, after which there is a steady – one might say inexorable – decline. (And don’t argue its a ‘pipeline’ issue, it’s not just a matter of time – women have been graduating at around 40% for decades now.)
Interestingly, there is a dip in the number of men aged 45–49, which corresponds to the last recession, but no such dip in women – they just keep on dropping.
Then Gill went a little further – making the same graph for those who work full time (35 hours a week or more). Surprise, surprise, the ‘decay’ for women is even more pronounced – reminding us of the importance of that elusive thing, meaningful part-time work in architecture.

Lastly Gill compared the 2011 census data with that from 2006. Interestingly, this suggests that demographic for men in architecture has shifted somewhat since 2006, with 2011 seeing more men in their thirties and early-mid forties, fewer men in their late-forties and fifties, and more again in their sixties. In contrast, there are more women in 2011 than 2006, but the age profile remains quite similar.

These graphs doesn’t tell us that much we didn’t already know, but they provide yet one more piece of evidence that things need to change or architecture will continue to lose a huge chunk of its ‘talent pool’ at a time when the profession really needs to keep smart, agile thinkers within its ranks.


4 comments
Jen Scott says:
Sep 17, 2013
Some serious sociology research into architectural companies might be instructive. In my experience management style is pretty much ad hoc. I have never met an architect with any kind of management education, which may mean we are not exposing ourselves current ideas. My own experience is if managing architects with a very personal perspective. The personal perspective I believe is far more subject to unconscious bias, which is very prevalent in Australia as seen by the latest make up of cabinet.
The attrition rates are a stark rendition of our real working experiences. I would advocate a continuing management education within the profession to address a very depressing prospect for new women graduates.
gill says:
Sep 17, 2013
Hi Jen
Funny you should mention that because my research is doing just that – going into offices and seeing what happens.
Your experience of the personal nature of relationships in architecture being vulnerable to unconscious bias is strongly backed by research in other fields.
Oh if the world really was a meritocracy.
Gill
Neph says:
Sep 17, 2013
It looks like men continue to register at a slower rate ages 35-39, while women stay static (basing this in the highly technical method of translating the 2006 line to the right by eye to compare to 2011 data). Hmmm.
Justine says:
Sep 17, 2013
Gill is working on some interesting graphs comparing the 2006 and 2011 census data. We’ll post it soon. (But remember that the census data doesn’t indicate registration)